

![What Is Liquidity? [Order Flow, Deviation, Market Profile, etc.]](https://taquant-content.s3.eu-north-1.amazonaws.com/books/what-is-liquidity/1774848475327-Screenshot_30-3-2026_132033_.jpeg)
WHAT IS LIQUIDITY?
Written by SoulzBTC
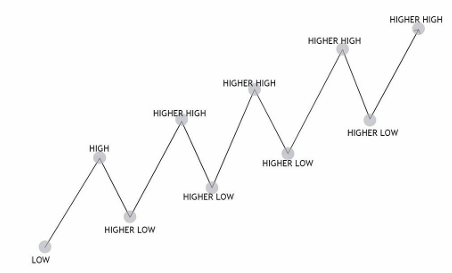
Introduction to Market Structure
What is Market Structure?
Market structure refers to the framework that determines how price moves through different phases. Understanding this structure is fundamental to successful trading because it reveals where institutional participants (the "big players") are likely to position themselves. However, we will not go through Market Structure in-depth in this PDF as I assume that most traders already know how and what it is.
Why Market Structure Matters
Market movement is simply a combination of buy and sell orders. When you understand where these orders cluster and how they interact, you gain insight into:
- Where price is likely to find support or resistance
- Where stop losses are clustered (liquidity pools)
- Where institutional traders need to fill large orders
- Probable direction of next major price move
Key Concept: Price always moves from liquidity to liquidity. This is the golden rule that underlies all the concepts in this guide.
Understanding Liquidity
What is Liquidity?
In trading, liquidity refers to the ability to buy or sell a large volume of an asset without significantly affecting its price. More practically, it's where orders are sitting in the market waiting to be filled.
Think of liquidity as "fuel" for price movement.
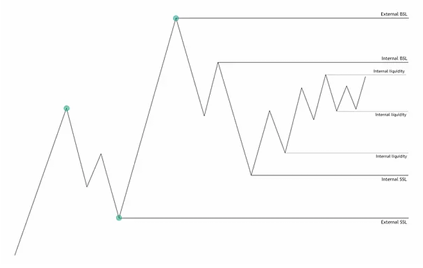
Types of Liquidity
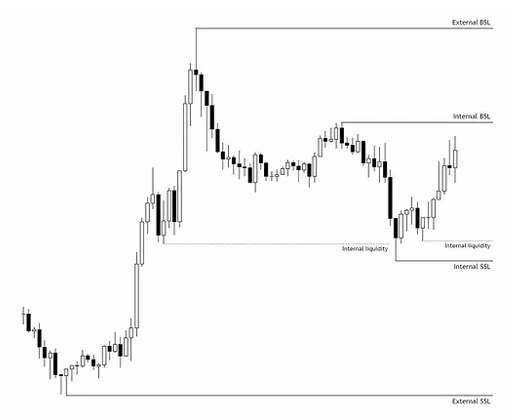
Internal Liquidity
Located inside a sideways movement or impulse, between structural highs and lows on your timeframe.
- Forms during corrections within trends
- Acts as minor support/resistance
- Used by institutions to add to positions
External Liquidity
Located outside the sideways movement, at structural swing highs and lows.
- Major support/resistance levels
- Where most retail stop losses cluster
- Primary target for institutional orders
Visual Example:
Time-Based Liquidity Zones
Certain levels carry special significance due to psychological and technical factors:
- Previous Day High/Low (PDH/PDL) - Most common intraday targets
- Previous Week High/Low (PWH/PWL) - Swing trading targets
- Previous Month High/Low (PMH/PML) - Position trading targets
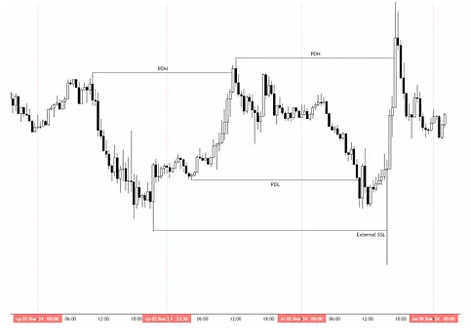
BSL and SSL
-
BSL (Buy Side Liquidity) - Liquidity above current price that acts as a target for upward moves
-
SSL (Sell Side Liquidity) - Liquidity below current price that acts as a target for downward moves
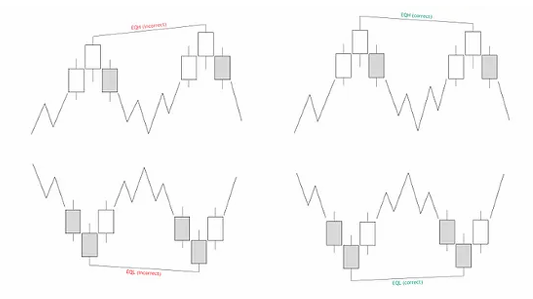
Equal Highs and Equal Lows (EQH/EQL)
Equal highs and lows represent significant liquidity accumulation zones.
Equal Highs (EQH):
- ● Multiple swing highs at approximately the same price level
- ● Retail traders place sell stops just above these levels
- ● Creates a "liquidity pool" that institutional traders target
Equal Lows (EQL):
- ● Multiple swing lows at approximately the same price level
- ● Retail traders place buy stops just below these levels
- ● Another liquidity pool for institutional accumulation
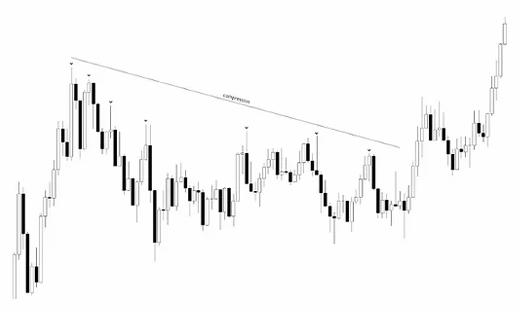
Compression
Compression refers to a sequence of highs and lows that form during corrective movements between key structural points.