


TA Quant Market Insights | April 6-12, 2026
Macro Overview
The global macro backdrop remains unsettled heading into this week. Trade policy continues to cast a long shadow across all asset classes, with Trump's tariff architecture now a year old and its effects fully embedded in economic data. We are past the point where tariff risks are a future concern. They are showing up in every data point right now.
February payrolls printed **negative **for the first time since COVID, and while March came in better than expected at 178,000 jobs with unemployment dipping to 4.3%, the broader trend remains fragile. The Fed is sitting in a tough spot. The funds rate holds at 3.50–3.75%, and CPI nowcasts have climbed to 3.71% from March's 3.25%, with PCE tracking at 3.58%, driven in part by energy shocks tied to ongoing Iran tensions. That inflation print has effectively killed any near-term rate cut expectations. Markets will be watching FOMC minutes on April 8 and ADP data on April 7 closely.
The Middle East conflict remains a live risk on our radar. Any escalation from here carries real second-order effects across oil, inflation expectations, and risk sentiment broadly.
Crypto: BTC and ETH

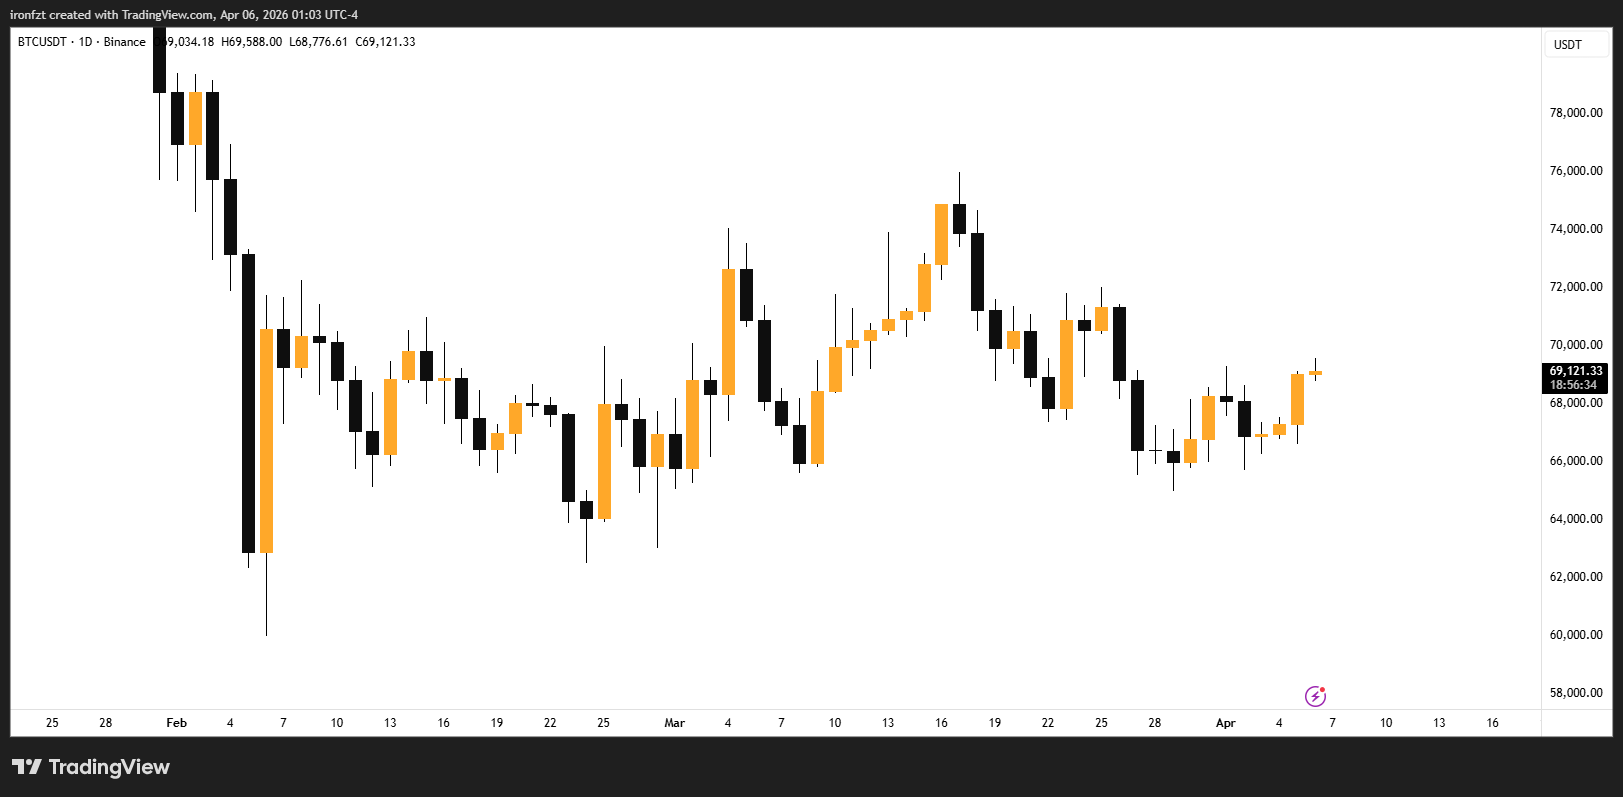
BTC is currently trading around $67,540, while ETH sits near $2,060. The Block The broader crypto market has been under sustained pressure, with total market capitalization sitting at approximately $2.38 trillion and the Fear and Greed Index registering at extreme fear levels.
That said, we are watching some interesting signals beneath the surface. Exchange netflows showed 8,400 BTC withdrawn in a single day recently, the largest outflow in three weeks, and addresses holding 100 to 1,000 BTC increased positions by 2.3%, pointing to institutional-size accumulation. Historically, this kind of behavior near extreme fear readings tends to precede bottoming patterns rather than continued sell-offs.
For ETH, the ETH/BTC ratio broke a 7-day downtrend recently, with the $2,050 to $2,100 range acting as a solid accumulation zone based on recent volume profiles. The next resistance cluster sits at $2,280 to $2,320.
Our view: sentiment is washed out, but macro headwinds are real. We are watching the $67,500 BTC support level closely as a short-term trend indicator. A sustained hold above that opens the door to a test of $70,200.
Forex
The US dollar has been under pressure for most of 2025 and into 2026, though recent inflation surprises have given it some footing. EUR/USD pulled back from 1.1818 to 1.1524 in March, with the ECB holding its deposit rate unchanged at 2.00% following 100bps of cuts last year. The rate differential between the Fed at 3.50–3.75% and the ECB at 2.00% remains a key driver of near-term dollar strength, but any dovish pivot from the Fed would shift that dynamic quickly.
On USD/JPY, the pair has been trading above 159 with a near-term bullish bias. The BoJ's April 28 policy meeting is the next major catalyst, with markets uncertain whether the central bank will offer clear forward guidance on rate hikes. A senior BoJ official has stated the central bank will continue raising rates if economic projections remain on track. FXStreet A BoJ hike plus any softening in US data is the combination that would put real pressure on USD/JPY longs.
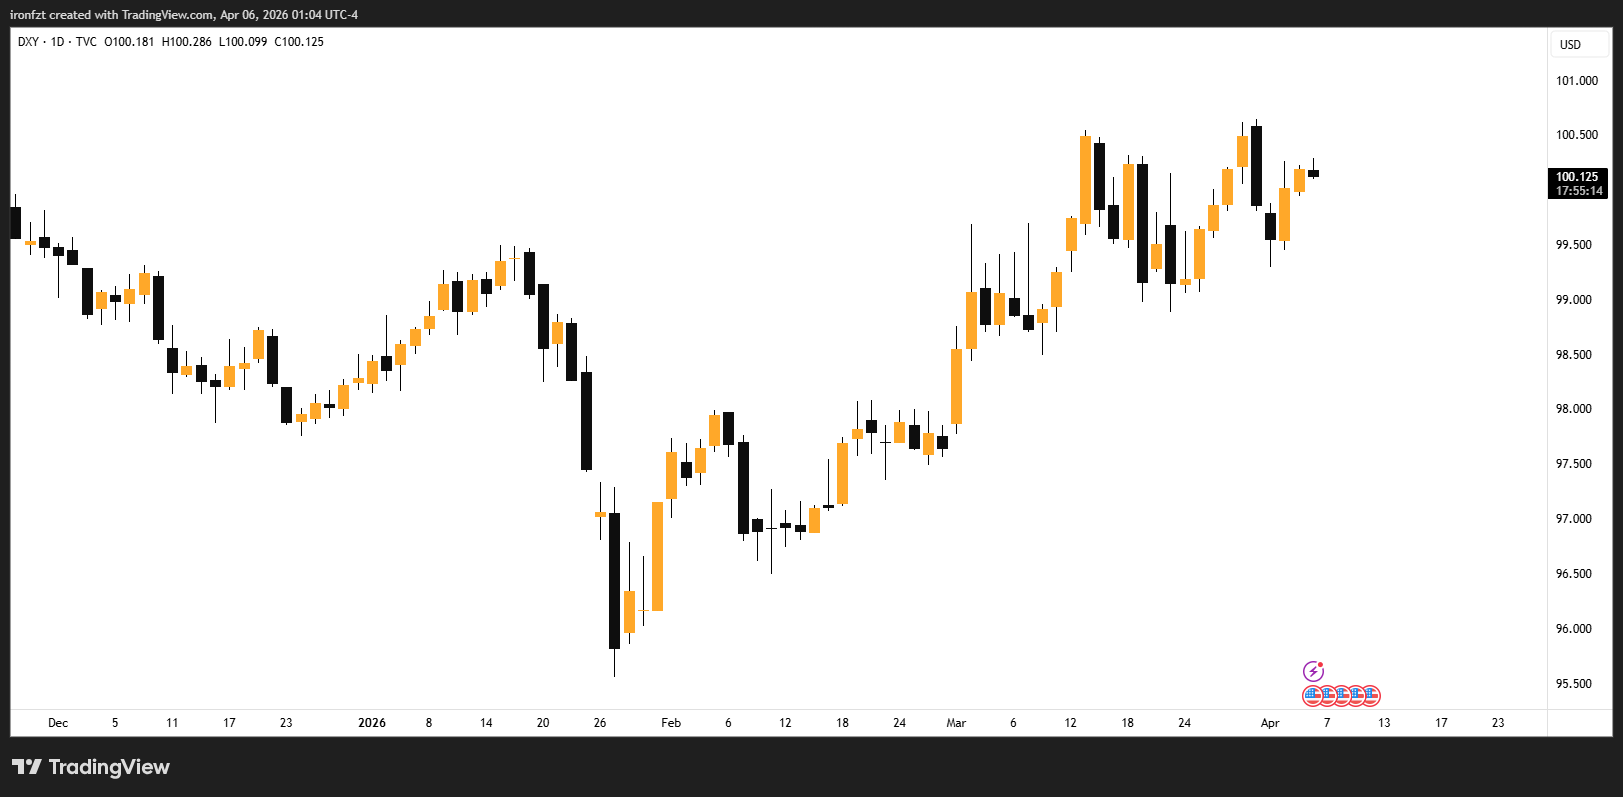
We are keeping a close eye on DXY as it tests key long-term support levels. A break lower there would have broad implications across pairs and commodities.
Gold
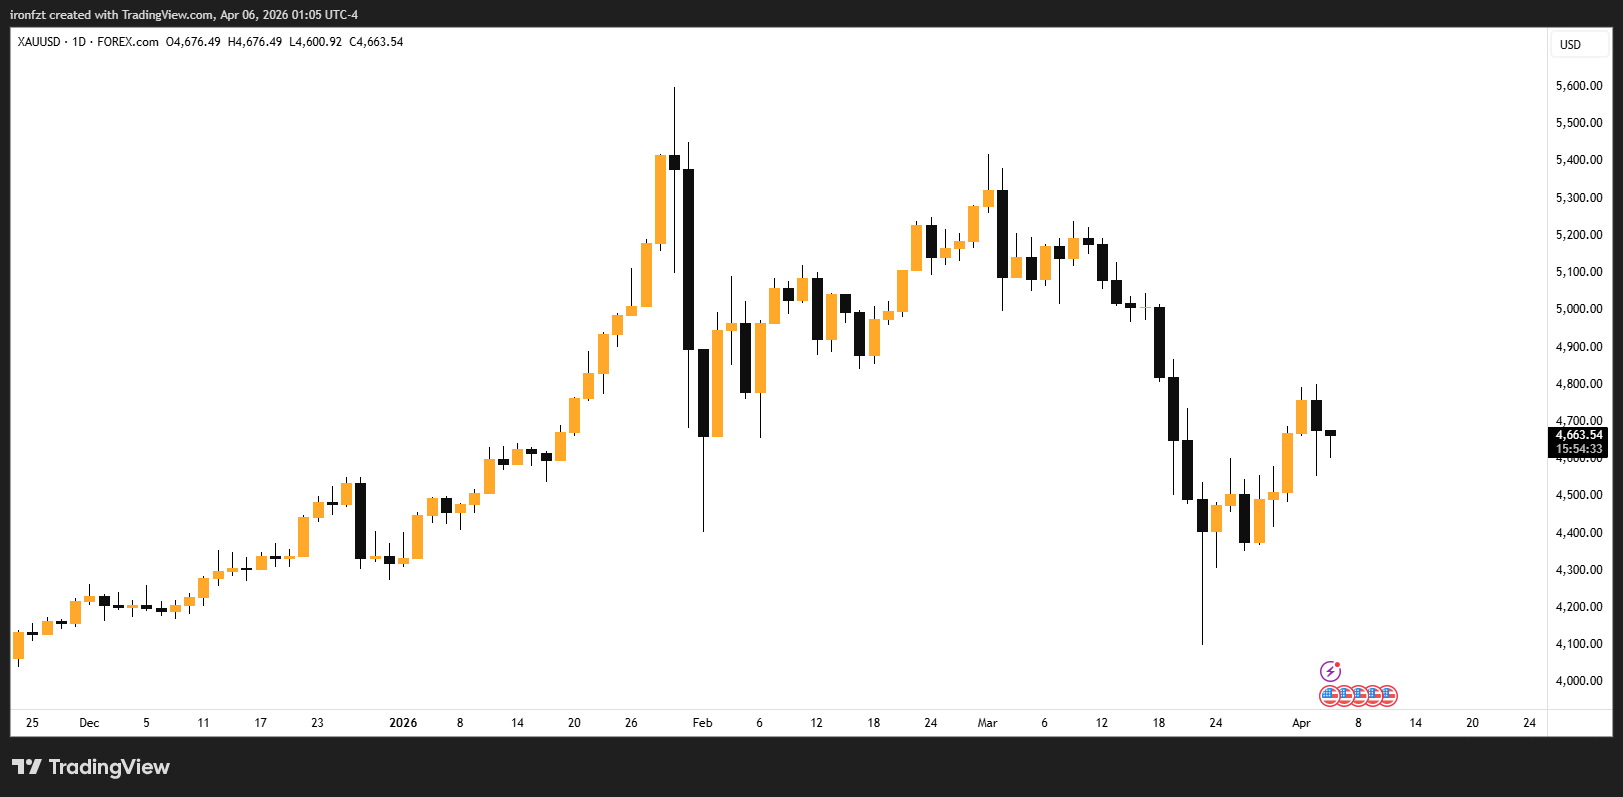
Gold remains one of the strongest macro stories of this cycle. Spot gold is trading around $4,676 as of April 5, with high volatility expected this week around FOMC minutes, US GDP data, and CPI release.
The structural bull case is intact. Central bank buying, Fed rate cuts, a weaker dollar, concerns about Fed independence, and ETF inflows are all still in play as primary drivers. J.P. Morgan projects gold demand averaging around 585 tonnes per quarter in 2026, and maintains strong conviction that prices are tracking toward $5,000 per ounce by Q4 2026.
Short-term, the metal is sensitive to Iran developments and any hawkish Fed repricing. U.S. ETF flows showed rotation out of commodities recently amid liquidity strains, though gold remains on track for a modest weekly gain of around 3% despite the recent pullback. We view dips as potential entries rather than trend reversals, given how well the macro setup holds up for gold over the medium term.
Our Take
Across all four areas, the theme is the same: elevated uncertainty with select opportunities for the patient and well-positioned. Crypto sentiment is deeply negative but accumulation signals are quietly building. Forex is driven by central bank divergence and geopolitical volatility. Gold retains its structural bid. And the macro picture hinges almost entirely on whether the Fed gets cover to ease or gets forced to hold.
We will continue monitoring these setups closely and keeping our clients informed as conditions develop.